Introduction:
It is impossible to overestimate the significance of actuators in today’s industries. Automation and robotics are made possible by actuators, which leads to faster production as well as increased precision and safety.Actuators are used in a wide range of industries, such as manufacturing, aerospace, automotive, robotics, and home automation, to perform important functions, such as opening and closing valves, moving robotic arms, adjusting control surfaces, or actuating brakes.
A device that moves or operates something is called an actuator. When an actuator receives a portion of the input energy as a feedback control signal, the actuator starts moving the machine part. In other terms, an actuator transforms energy into mechanical or physical motion. An actuator’s primary function is to regulate a machine’s internal motions. It is a critical component in many systems and machines, providing the force and motion necessary for various operations.

Actuators can be categorized into 2 categories based on their source of energy and their range of motion. The 1st category includes Electrical, Hydraulic, Pneumatic,etc and the 2nd category includes linear and rotary actuators.

Section 1: Types of Actuators based on their range of motion:
As mentioned before, actuators can be grouped according to their range of motion, for as whether they provide linear or rotary motion. Rotating actuators produce rotation around an axis, whereas linear actuators produce motion in a straight line. Engineers and designers can choose the most suitable actuator for their unique needs by being aware of the differences between various types of actuators.
Linear Actuators:
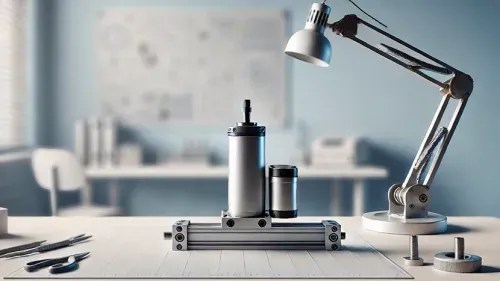
Linear actuators consist of several components, including a motor, lead screw, and guide rod. The motor provides the energy needed to move the actuator, while the lead screw translates rotational motion into linear motion. The guide rod ensures that the actuator moves in a straight line and prevents it from rotating.

Rotary Actuators:
On the other hand, Rotary actuators as mentioned above rotate around their axis or simply create a circular motion, Rotary actuators generally consist of a shaft, housing, and internal mechanism. The shaft is the central part of the actuator that rotates around an axis. The housing encloses the internal mechanism, which may include gears, pistons, or other mechanisms that produce rotational motion. Rotary actuators have sub-sections that will be discussed on a blog specified for rotary actuators.

Section 2: Types of Actuators Based on Their Energy source:
The 3 most popular types of actuators based on their energy source are Electrical, Pneumatic and Hydraulic actuators – There are other types but not as popular so they will not be discussed, for extra information you can check the resources provided at the end of the blog- each type has its own advantages and disadvantages that will be discussed in this section.
Electrical Actuators:
Electrical actuators, as it’s suggested from the name, which gives them some distinct advantages. They are known for being quieter than their counterparts, offering high levels of accuracy and precision. They also provide complete control over motion profiles and are easily programmable, making them suitable for a wide range of applications.
Despite their benefits, electric actuators also have some drawbacks. They can overheat, and their parameters such as speed and torque are fixed. Additionally, they tend to be more expensive than pneumatic or hydraulic actuators
Acrome’s Stewart platform integrates electrical actuators in their systems such as stewart platforms so it offers high precision alongside being easy to program making it perfect for use in research labs and universities.


Hydraulic Actuators:
To create force and motion, hydraulic actuators employ pressurized fluid. They are renowned for having a high power density and the capacity to produce significant forces, which makes them perfect for use in heavy-duty machinery and equipment for the construction and industrial sectors. Moreover, hydraulic systems can offer exact control over motion’s speed and direction, making them appropriate for uses where precise placement is important.
Yet, there are certain disadvantages to using hydraulic actuators. Leaks can be challenging to find and fix, and they need regular maintenance to keep the hydraulic fluid clean and clear of impurities. Due to the necessity for pumps, hoses, and other components, hydraulic systems can be expensive to build and maintain. Additionally, because the hydraulic fluid can become contaminated with particles over time, hydraulic systems might not be appropriate for situations where cleanliness is crucial.

Pneumatic Actuators:
Pneumatic actuators, on the other hand, use compressed air to generate force and motion. They are commonly used in industries where electrical power sources may not be available or not suitable due to safety concerns. Pneumatic actuators are lightweight, relatively inexpensive, and offer fast and precise operation. They are often used in applications where speed is critical, such as in the automation of assembly lines.
However, pneumatic systems require a steady supply of compressed air, which can be costly to generate and maintain. They are also not as powerful as hydraulic or electrical actuators, which limits their use in heavy-duty applications. Despite these limitations, pneumatic actuators are still a popular choice for many industrial applications due to their reliability and efficiency.

Conclusion:
In conclusion, actuators play a crucial role in various industries, enabling automation and robotics to improve production speed, precision, and safety. With a wide range of applications in manufacturing, aerospace, automotive, robotics, and home automation, the choice of actuator depends on factors such as the energy source and the range of motion required.
We have explored the different types of actuators based on their range of motion, as well as their energy sources. Each type has its own unique advantages and disadvantages, making it essential for engineers and designers to select the most appropriate actuator for their specific needs.
In this blog series we will take a deep look into each type of actuator, providing a comprehensive understanding of their operation and potential applications. Stay tuned to learn more about the fascinating world of actuators and how they continue to shape our technological advancements.
To learn more about actuators and their applications, consider exploring the following resources:
- Sclater, N., & Chironis, N. P. (2001). Mechanisms and Mechanical Devices Sourcebook. New York: McGraw-Hill. [A comprehensive guide to various types of actuators and their applications]
- Rajput, R. K. (2018). A Textbook of Fluid Mechanics and Hydraulic Machines. New Delhi: Laxmi Publications. [A resource for understanding hydraulic actuators]
- Pippenger, J. (2007). Pneumatic Actuators: For Industrial Automation. New York: Momentum Press. [A detailed introduction to pneumatic actuators]
- Kuo, B. C. (2003). Automatic Control Systems. New Jersey: Prentice Hall. [A book covering various types of control systems, including those using actuators]
- Uicker, J. J., Pennock, G. R., & Shigley, J. E. (2003). Theory of Machines and Mechanisms. New York: Oxford University Press. [A textbook providing an in-depth understanding of machines and mechanisms, including actuators]
- International Society for Automation (ISA) [A professional organization with resources on automation, including articles and research papers on actuators]


