Author: QuakeLogic

Engineering knowledge hub

QuakeLogic

Curated QuakeLogic articles, application notes, and technical explainers for engineering teams.

Areas of expertiseSeismic monitoring, structural health monitoring, testing systems, data acquisition, and applied engineering education.
Dam structural health monitoring system by QuakeLogic
Blog

Dam Structural Health Monitoring

Dam structural health monitoring is a vital necessity for modern hydroelectric facilities. Hydroelectric dams provide clean energy and support economies worldwide, but they face constant environmental pressures and seismic threats. Therefore, site...

Jul 12, 20263 min read

Discover the Most Advanced 1-Ton Uniaxial Shake Table

tdg 1ton 1 for "Unlocking Seismic Safety: The Power of Shake Tables in Structural Engineering"

QuakeLogic is proud to introduce our state-of-the-art 1-ton Uniaxial Shake Table, designed to bring unparalleled precision and power to your seismic testing needs. With a 1-ton payload capacity, this shake table is an indispensable tool for engineers and researchers focused on enhancing structural integrity and earthquake resilience.

Key specifications

A spacious top table with dimensions of 150×150 cm (L x W), capable of delivering up to ±1 g acceleration at 1-ton capacity, with a stroke of ±200 mm.

Powered by an advanced electro-mechanical servo motor, this shake table ensures smooth and quiet operation. Unlike traditional hydraulic systems, our shake table is practically maintenance-free, making it a hassle-free addition to your lab.

This IP-based system allows for remote operation and monitoring, providing flexibility and control like never before. Designed for ease of use, the shake table comes with our intuitive EASYTEST software, which requires no specialized computer cards and runs seamlessly on any Windows machine. Plus, its compact design means it’s ready to be installed quickly, so you can start testing without delay.

For more information, visit our product page HERE or contact us at sales@quakelogic.net

QL customer satisfaction for "Biaxial Shake Table: Revolutionizing Seismic Testing Across Industries"

About QuakeLogic

QuakeLogic is a leading provider of advanced seismic monitoring solutions, offering a range of products and services designed to enhance the accuracy and efficiency of testing, data acquisition, and analysis.

Contact Information:

For more information about our products and services, please visit our website or contact our sales team. We are here to help you with all your testing and monitoring needs.

Last reviewed: 2026-07-04

Executive Summary

Shake tables reproduce controlled motion in the laboratory so engineers can evaluate components, assemblies, soil boxes, and structural models under seismic inputs. This article has been expanded as an engineering resource for readers evaluating shake tables concepts, instrumentation choices, and monitoring workflows. The discussion is educational and should be paired with project-specific review by qualified engineers, applicable codes, owner requirements, and equipment documentation.

Key Takeaways

  • Define the engineering objective before selecting sensors, test equipment, trigger thresholds, or reporting workflows.
  • Use calibrated instrumentation, documented installation practices, time synchronization, and traceable data handling where measurement quality matters.
  • Interpret measured data in context: site conditions, structure type, noise environment, sampling rate, bandwidth, and boundary conditions all affect conclusions.
  • Use authoritative references and project-specific criteria rather than relying on generic thresholds or unsupported performance claims.

Technical Explanation

In practical shake tables work, the engineering system is more than a sensor or a test platform. A credible workflow includes the measurement objective, instrument selection, mounting or boundary conditions, sampling and timing strategy, data validation, event or response detection, engineering review, and reporting. Weakness in any part of that chain can reduce confidence in the final interpretation.

For monitoring applications, engineers should document sensor orientation, coupling, environmental exposure, dynamic range, frequency bandwidth, data logger configuration, clock synchronization, communications, and maintenance procedures. For testing applications, engineers should document input motion, fixture design, payload properties, control limits, safety interlocks, acceptance criteria, and post-test data review.

Engineering Applications

ApplicationEngineering QuestionTypical Evidence Needed
Research and educationHow does a structure, component, or sensor respond under controlled conditions?Test plan, calibrated data, input motion, boundary conditions, and repeatable observations.
Critical infrastructureIs the asset response normal, changing, or potentially unsafe after an event?Baseline data, event records, thresholds, inspection workflow, and engineering sign-off.
Industrial facilitiesCan monitoring support operational continuity and response decisions?Site-specific criteria, reliable telemetry, alarm logic, maintenance records, and documented procedures.

People Also Ask

What should be specified before buying equipment?

Specify the measurement objective, frequency range, amplitude range, environment, data format, timing needs, installation constraints, reporting requirements, and applicable standards or owner criteria.

Why do references and standards matter?

They provide terminology, acceptance criteria, test methods, and documentation expectations. They do not replace engineering judgment, but they reduce ambiguity and make results easier to review.

How should data quality be checked?

Review calibration status, timing, clipping, sensor orientation, signal-to-noise ratio, environmental artifacts, data completeness, and whether the record supports the engineering decision being made.

Related QuakeLogic Resources

References

Recommended Diagram or Download

Media placeholder: Add an original diagram showing the measurement chain from sensor or test platform to data acquisition, analysis, engineering interpretation, and reporting. Where this article becomes a buyer guide or application note, create a downloadable PDF version after engineering review.

Discuss a Monitoring or Testing Application

QuakeLogic supports seismic monitoring, earthquake early warning, structural health monitoring, infrasound monitoring, vibration monitoring, data acquisition, and shake table testing applications. For project-specific guidance, contact QuakeLogic with the asset type, measurement objective, site constraints, and required deliverables.

Bringing Earthquake Science to Life in the Classroom with the ATOM Shake Table

Shake table testing equipment for "Instructions for Maintaining the ATOM Shake Table in a Lab Environment"

Understanding earthquakes and their impact on structures is a critical part of education, especially in the fields of science and engineering studies. Teaching these concepts can be challenging without the right tools. Enter QuakeLogic’s ATOM Shake Table—a game-changer for educational environments. The ATOM Shake Table offers a hands-on, interactive way to demonstrate the effects of seismic activity in the classroom, making earthquake science both accessible and engaging.

What is the ATOM Shake Table? The ATOM Shake Table by QuakeLogic is America’s #1 Most Loved ❤️ and #1 Most Wanted UNIAXIAL DESKTOP SHAKE TABLE!

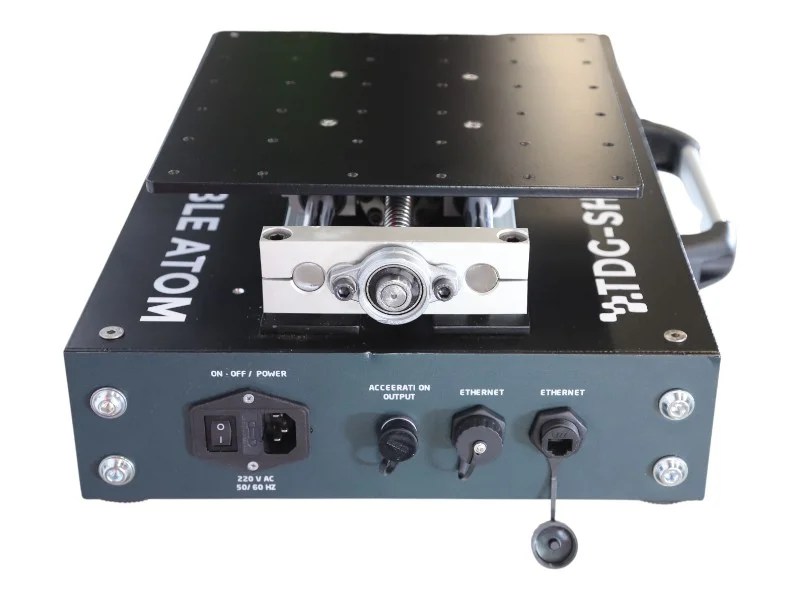
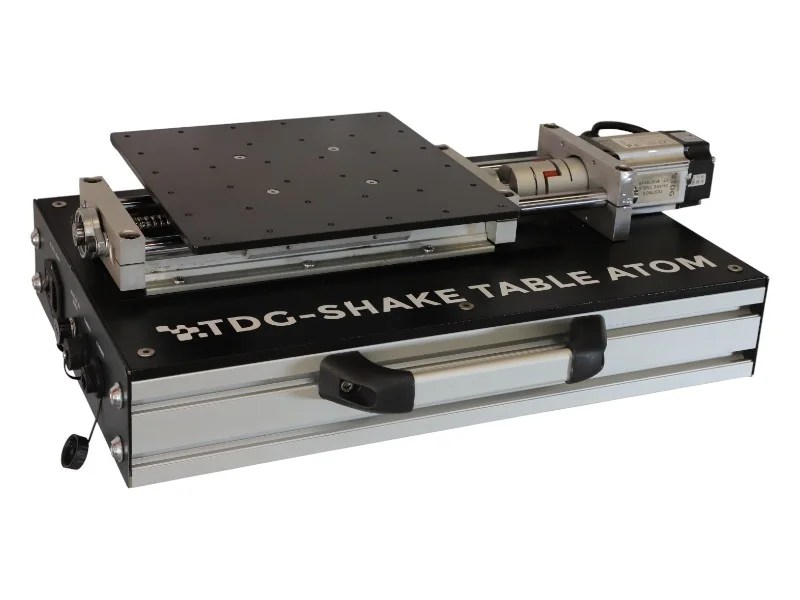
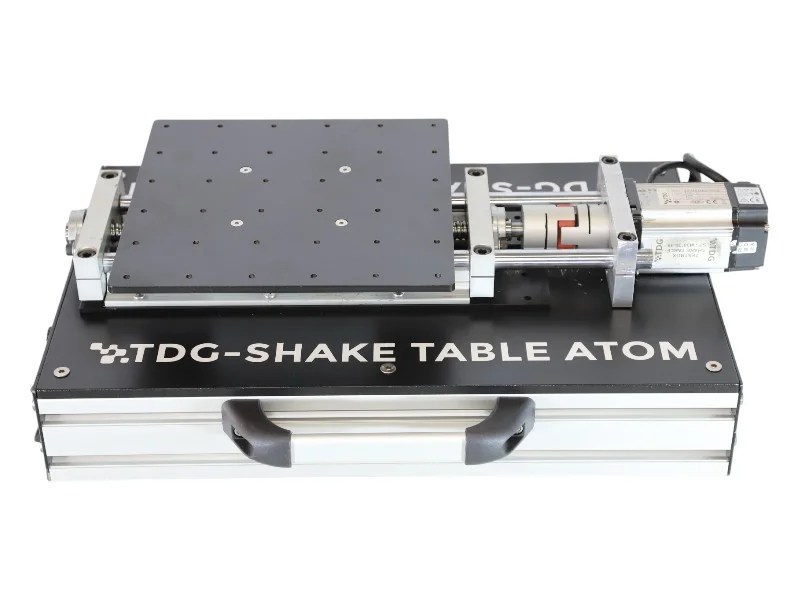
Compact, portable, and powerful, it is designed to simulate earthquake conditions in a controlled environment. It’s perfect for classrooms, labs, and science fairs, allowing students to observe how different structures respond to seismic forces. With a 50-kg payload capacity, this versatile tool brings earthquake science to life in a way that textbooks alone cannot.

  • ATOM46 Photoroom for "Bringing Earthquake Science to Life in the Classroom with the ATOM Shake Table"
  • ATOM51 Photoroom for "Bringing Earthquake Science to Life in the Classroom with the ATOM Shake Table"
  • ATOM54 Photoroom for "Bringing Earthquake Science to Life in the Classroom with the ATOM Shake Table"
  • ATOM57 Photoroom for "Bringing Earthquake Science to Life in the Classroom with the ATOM Shake Table"

Key Features of the ATOM Shake Table:

  • Portable and Durable: Despite its robust construction, the ATOM Shake Table is lightweight and comes with a hard case equipped with wheels for easy transport. Move it effortlessly between classrooms or take it on the road for off-site demonstrations.
  • 50-kg Payload Capacity: Capable of handling up to 50 kg, the ATOM Shake Table provides a powerful platform for testing various models and structures.
  • Realistic Seismic Simulation: Achieve up to 1 g peak acceleration with a ±125 mm stroke at a 50-kg payload. This capability allows you to replicate a wide range of seismic events, from mild tremors to powerful quakes, giving students a real-world understanding of how different magnitudes affect structures.
  • Smooth and Quiet Performance: Powered by advanced servo motor technology, the ATOM Shake Table delivers smooth and quiet operation, ensuring an uninterrupted learning experience.
  • User-Friendly Software: Its control software, EASYTEST, is beautifully designed, simple to use, and incredibly user-friendly. EASYTEST controls everything from data logging to real-time visualizations, making the entire process seamless. There’s no need for additional software or post-processing—everything you need is right at your fingertips.

Educational Benefits: The ATOM Shake Table provides numerous educational benefits:

  • Interactive Learning: Students can engage in hands-on experiments by building their own models and testing them under simulated earthquake conditions. This active learning approach reinforces theoretical concepts and fosters critical thinking.
  • Visual and Practical Demonstrations: Instead of relying solely on textbooks and lectures, the ATOM Shake Table allows students to witness the effects of earthquakes in real-time, making abstract concepts more tangible.
  • Collaborative Projects: The shake table is ideal for group projects, encouraging teamwork as students collaborate to design, build, and test their structures.

Why Choose QuakeLogic’s ATOM Shake Table? QuakeLogic is a leader in seismic testing technology, and the ATOM Shake Table reflects our commitment to quality and innovation. We understand the importance of providing educators with reliable tools that enhance learning, which is why the ATOM Shake Table is built to the highest standards. With QuakeLogic, you’re not just getting a product—you’re gaining a partner in education.

We also offer a modular PLEXIGLASS MODEL STRUCTURE and GEOBOX to simulate structural dynamics as well as liquefaction, landslides and lateral spreading. The photo below shows the GEOBOX.

Conclusion: Incorporating the ATOM Shake Table into your classroom can transform the way students understand and appreciate the science of earthquakes. It’s more than just a teaching tool; it’s a gateway to deeper learning and discovery.

Contact Us: For more information or to purchase the ATOM Shake Table for your classroom, reach out to us at sales@quakelogic.net. Let’s work together to make earthquake science an engaging and impactful part of your curriculum!


Last reviewed: 2026-07-04

Executive Summary

Shake tables reproduce controlled motion in the laboratory so engineers can evaluate components, assemblies, soil boxes, and structural models under seismic inputs. This article has been expanded as an engineering resource for readers evaluating shake tables concepts, instrumentation choices, and monitoring workflows. The discussion is educational and should be paired with project-specific review by qualified engineers, applicable codes, owner requirements, and equipment documentation.

Key Takeaways

  • Define the engineering objective before selecting sensors, test equipment, trigger thresholds, or reporting workflows.
  • Use calibrated instrumentation, documented installation practices, time synchronization, and traceable data handling where measurement quality matters.
  • Interpret measured data in context: site conditions, structure type, noise environment, sampling rate, bandwidth, and boundary conditions all affect conclusions.
  • Use authoritative references and project-specific criteria rather than relying on generic thresholds or unsupported performance claims.

Technical Explanation

In practical shake tables work, the engineering system is more than a sensor or a test platform. A credible workflow includes the measurement objective, instrument selection, mounting or boundary conditions, sampling and timing strategy, data validation, event or response detection, engineering review, and reporting. Weakness in any part of that chain can reduce confidence in the final interpretation.

For monitoring applications, engineers should document sensor orientation, coupling, environmental exposure, dynamic range, frequency bandwidth, data logger configuration, clock synchronization, communications, and maintenance procedures. For testing applications, engineers should document input motion, fixture design, payload properties, control limits, safety interlocks, acceptance criteria, and post-test data review.

Engineering Applications

ApplicationEngineering QuestionTypical Evidence Needed
Research and educationHow does a structure, component, or sensor respond under controlled conditions?Test plan, calibrated data, input motion, boundary conditions, and repeatable observations.
Critical infrastructureIs the asset response normal, changing, or potentially unsafe after an event?Baseline data, event records, thresholds, inspection workflow, and engineering sign-off.
Industrial facilitiesCan monitoring support operational continuity and response decisions?Site-specific criteria, reliable telemetry, alarm logic, maintenance records, and documented procedures.

People Also Ask

What should be specified before buying equipment?

Specify the measurement objective, frequency range, amplitude range, environment, data format, timing needs, installation constraints, reporting requirements, and applicable standards or owner criteria.

Why do references and standards matter?

They provide terminology, acceptance criteria, test methods, and documentation expectations. They do not replace engineering judgment, but they reduce ambiguity and make results easier to review.

How should data quality be checked?

Review calibration status, timing, clipping, sensor orientation, signal-to-noise ratio, environmental artifacts, data completeness, and whether the record supports the engineering decision being made.

Related QuakeLogic Resources

References

Recommended Diagram or Download

Media placeholder: Add an original diagram showing the measurement chain from sensor or test platform to data acquisition, analysis, engineering interpretation, and reporting. Where this article becomes a buyer guide or application note, create a downloadable PDF version after engineering review.

Discuss a Monitoring or Testing Application

QuakeLogic supports seismic monitoring, earthquake early warning, structural health monitoring, infrasound monitoring, vibration monitoring, data acquisition, and shake table testing applications. For project-specific guidance, contact QuakeLogic with the asset type, measurement objective, site constraints, and required deliverables.
What is the UNI 9916 Standard and the Role of Peak Particle Velocity (PPV) in Human Comfort Evaluation?

uni9916 2 for "What is the UNI 9916 Standard and the Role of Peak Particle Velocity (PPV) in

The UNI 9916 standard, formally titled “Criteria for the Measurement of Vibrations and the Assessment of Their Effects on Buildings,” is a crucial guideline in the field of vibration analysis and monitoring. This standard, established by the Italian National Unification Body (UNI), provides a comprehensive framework for assessing the impact of vibrations on structures and human comfort. A key metric in this standard is the Peak Particle Velocity (PPV), which plays a vital role in evaluating how vibrations affect human comfort. In this blog, we’ll delve into the UNI 9916 standard, its applications, and the significance of PPV in monitoring vibrations.

Overview of UNI 9916 Standard

The UNI 9916 standard outlines the methods for measuring and evaluating vibrations in buildings and structures to ensure they remain within acceptable limits. It is particularly concerned with the impact of vibrations on both the structural integrity of buildings and the comfort of their occupants. The standard is widely used in various sectors, including construction, transportation, and industrial operations, where vibrations can be a significant concern.

What is Peak Particle Velocity (PPV)?

Peak Particle Velocity (PPV) is a measure of the maximum speed at which particles in a material move due to vibrational energy. In simpler terms, it quantifies the intensity of vibrations. PPV is typically expressed in millimeters per second (mm/s) or inches per second (in/s). It is a critical parameter because it directly correlates with the potential for damage to structures and the level of discomfort experienced by humans.

How to Compute PPV

The PPV is calculated using the following formula:

PPV=max(|v(t)|)

where:

  • v(t) is the particle velocity at time t,
  • max(|v(t)|) represents the maximum absolute value of the particle velocity over a given time period.

In practical applications, the particle velocity v(t) is often measured using sensors placed on structures or in the ground. The PPV is then determined by analyzing the sensor data over a specified duration.

The Role of PPV in Human Comfort Evaluation

When it comes to human comfort, vibrations can be a source of annoyance, stress, and even health issues if they exceed certain thresholds. The UNI 9916 standard uses PPV as a primary metric to assess the impact of vibrations on human comfort. Here’s how PPV is employed in this context:

  1. Establishing Thresholds:
    The standard sets specific PPV thresholds that should not be exceeded to ensure human comfort. These thresholds are determined based on extensive research and field studies that consider the human body’s sensitivity to different vibration frequencies and intensities.
  2. Continuous Monitoring:
    By continuously monitoring PPV, engineers and facility managers can ensure that vibration levels remain within the acceptable range. This is particularly important in environments where vibrations are a constant, such as near construction sites, railways, or industrial operations.
  3. Mitigation Measures:
    If PPV readings exceed the thresholds, immediate action can be taken to mitigate the vibrations. This might involve altering operational procedures, installing vibration dampening systems, or even redesigning certain aspects of the infrastructure to reduce vibration transmission.
  4. Compliance and Reporting:
    Compliance with the UNI 9916 standard often requires regular reporting of PPV measurements. These reports help demonstrate that an organization is taking the necessary steps to protect both their structures and the well-being of occupants.

Moving Window Data Samples

To accurately measure PPV, the data is often analyzed using a moving window approach. This involves dividing the continuous stream of vibration data into smaller, overlapping segments or “windows.” Each window is analyzed separately to determine the PPV within that specific time frame.

The steps for using moving window data samples are as follows:

  1. Data Collection:
    Vibration data is continuously collected using sensors over a period of time.
  2. Windowing:
    The data is divided into overlapping segments or windows. The size of each window and the amount of overlap are chosen based on the specific application and desired resolution.
  3. PPV Calculation:
    For each window, the PPV is calculated using the formula mentioned above. This provides a series of PPV values corresponding to different time intervals.
  4. Analysis:
    The series of PPV values are analyzed to identify any periods where the vibrations exceed the acceptable thresholds. This helps in pinpointing specific events or activities that cause excessive vibrations.

Practical Applications

  1. Construction Sites:
    During construction activities, heavy machinery and demolition can generate significant vibrations. Monitoring PPV ensures that these vibrations do not adversely affect nearby buildings or the comfort of residents.
  2. Transportation Networks:
    Railways and highways are common sources of vibrations. By adhering to the UNI 9916 standard, transportation authorities can minimize the impact of these vibrations on adjacent properties and communities.
  3. Industrial Operations:
    Factories and plants often have equipment that generates continuous vibrations. Regular monitoring of PPV helps maintain a comfortable and safe environment for workers.

QuakeLogic’s Role in Vibration Monitoring

QuakeLogic provides advanced dataloggers, seismographs, and accelerographs equipped with built-in functions to compute and plot PPV values against frequencies, adhering to the UNI 9916 standard. These tools offer several advantages:

  1. Integrated GUI:
    QuakeLogic’s devices come with a user-friendly graphical user interface (GUI) that allows for real-time monitoring and analysis of vibration data. The GUI can display PPV values across different frequencies, enabling quick assessment and decision-making.
  2. Automated Data Processing:
    The built-in software automatically processes the collected data, applying the moving window technique to compute PPV values. This automation ensures accuracy and consistency in the measurements.
  3. Visualization and Reporting:
    The devices can generate detailed plots showing PPV values against frequencies. These visualizations help in understanding the frequency components of the vibrations and their potential impact on human comfort and structural integrity.

Conclusion

The UNI 9916 standard, “Criteria for the Measurement of Vibrations and the Assessment of Their Effects on Buildings,” is an essential tool for managing the effects of vibrations on structures and human comfort. By focusing on Peak Particle Velocity (PPV), the standard provides a clear and measurable way to evaluate and mitigate the impact of vibrations. Whether in construction, transportation, or industrial settings, adhering to this standard ensures that both buildings and their occupants are protected from the potentially harmful effects of excessive vibrations.

Understanding and implementing the UNI 9916 standard is crucial for engineers, facility managers, and anyone involved in operations where vibrations are a concern. QuakeLogic’s advanced vibration monitoring tools further enhance the ability to comply with this standard, providing accurate measurements, real-time analysis, and comprehensive reporting. By prioritizing human comfort and structural integrity, we can create safer and more pleasant environments for everyone.


About QuakeLogic

QuakeLogic is a leading provider of advanced seismic monitoring solutions, offering a range of products and services designed to enhance the accuracy and efficiency of testing, data acquisition, and analysis.

Contact Information:

For more information about our products and services, please visit our website or contact our sales team. We are here to help you with all your testing and monitoring needs.

Last reviewed: 2026-07-04

Executive Summary

Seismic sensors and seismographs convert ground motion into usable engineering data for site characterization, monitoring, event detection, and post-event analysis. This article is maintained as a QuakeLogic engineering resource for readers evaluating terminology, applications, instrumentation, and practical implementation considerations. The content is educational and should be reviewed against project-specific requirements, applicable standards, manufacturer documentation, and qualified engineering judgment.

Key Takeaways

  • Start with the engineering objective, operating environment, required measurements, and decision workflow.
  • Use calibrated instrumentation, documented configuration, appropriate sampling, and traceable data handling where results support engineering decisions.
  • Interpret results in context; boundary conditions, installation quality, noise, bandwidth, and site conditions can materially affect conclusions.
  • Use standards and references as guidance, not as substitutes for project-specific engineering review.

Technical Explanation

A credible engineering workflow links the physical system, the measurement chain, data acquisition, processing, interpretation, and reporting. For testing, that means documenting the input, payload, fixture, limits, safety controls, and acceptance criteria. For monitoring, that means documenting sensor type, placement, orientation, coupling, timing, communications, maintenance, alarm logic, and review procedures.

Engineering Applications

Use CasePrimary QuestionUseful Documentation
Research or educationWhat behavior can be measured, demonstrated, or repeated?Test plan, configuration notes, input data, calibration records, and observations.
Infrastructure or facility monitoringIs response normal, changing, or outside expected limits?Baseline data, event records, thresholds, inspection notes, and engineering review.
Product or system selectionWhich specifications matter for the application?Measurement range, bandwidth, accuracy, environment, integration needs, and deliverables.

People Also Ask

What information should be gathered before selecting equipment?

Define the measurement objective, expected amplitude and frequency range, installation environment, data format, timing requirements, communications, reporting needs, and applicable standards.

How can data quality be protected?

Use appropriate sensor mounting, calibration, channel naming, time synchronization, clipping checks, noise review, and documented maintenance procedures.

When is human engineering review required?

Human review is required when results affect safety, compliance, operations, procurement, structural assessment, or emergency response decisions.

Related Technologies and Resources

References

Recommended Media

Media placeholder: Add an original diagram, workflow graphic, comparison chart, product illustration, lab photograph, or installation schematic after technical review. Do not use stock imagery where readers need to inspect real equipment or engineering details.

Discuss an Application with QuakeLogic

QuakeLogic supports seismic monitoring, earthquake early warning, structural health monitoring, infrasound monitoring, vibration monitoring, data acquisition, robotics education, and shake table testing workflows. For project-specific guidance, contact QuakeLogic with the application, measurement objective, environment, and required deliverables.