Author: QuakeLogic

Engineering knowledge hub

QuakeLogic

Curated QuakeLogic articles, application notes, and technical explainers for engineering teams.

Areas of expertiseSeismic monitoring, structural health monitoring, testing systems, data acquisition, and applied engineering education.
QuakeLogic QL-SeismoSense Device
Blog

Acoustic Emission Monitoring System Guide

QL-SeismoSense combines high-sensitivity acoustic emission sensors, multi-channel acquisition, FPGA signal processing, and GPS-synchronized timing to detect cracking, fatigue, and material degradation before damage becomes visible.

Jul 5, 20263 min read

Rotational Seismology with Tellus-R Seismometer

tellus r 4 Photoroom for "Rotational Seismology with Tellus-R Seismometer"

For decades, seismology has been defined by three translational components—X, Y, and Z.

Yet earthquakes do more than shift the ground; they also twist it. These subtle rotational motions hold vital insights into how seismic waves travel, how structures respond, and how hazards can be better understood. This is the foundation of rotational seismology, a rapidly advancing field that’s reshaping earthquake science.

Why Rotational Seismology Matters

Adding rotational motion to traditional measurements unlocks a fuller picture of seismic activity:

  • Seismic wavefield analysis: enables accurate modeling of wave propagation, scattering, and shear wave splitting.
  • Structural health monitoring: reveals torsional building responses often missed by translational sensors.
  • Engineering applications: improves earthquake-resistant design and helps refine seismic codes.

By recording all six degrees of freedom (6-DOF), rotational seismology bridges the gap between theoretical models and real-world earthquake impacts.

Tellus-R: Precision in Rotational Sensing

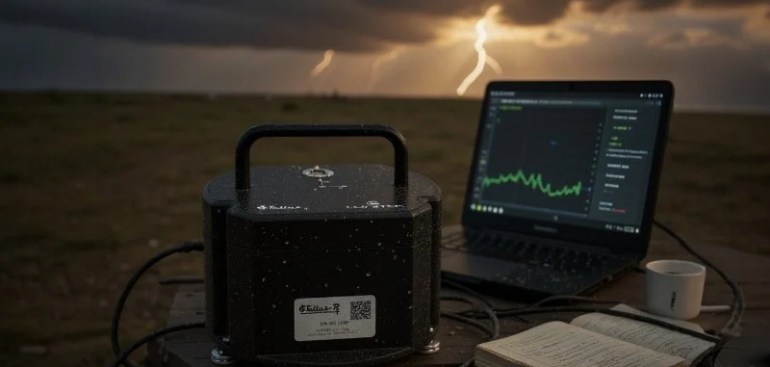
At the forefront of this movement is Tellus-R, a low-noise rotational seismometer built for both research and applied monitoring. It combines unmatched sensitivity, low power consumption, and rugged reliability.

tellus r 2 Photoroom for "Rotational Seismology with Tellus-R Seismometer"

Key Performance Highlights:

  • Resolution: 6×10⁻⁸ rad/s at 1 Hz
  • Dynamic range: 117 dB
  • Frequency range: 0.033–50 Hz (optional 0.01–100 Hz)
  • Noise floor: –125 dB (rel. 1 rad/s² Hz)
  • Power consumption: 30 mA at 10–18 VDC
  • Calibration input: optional 1:1 verification channel

Tellus-R’s hard-coated anodized aluminum body (IP67/IP68) ensures protection against harsh environments. Compact (Ø180 mm × 140 mm, 2 kg) yet robust, it operates in any orientation across temperatures from –15 °C to +55 °C (–40 °C optional).

Applications Across Science and Engineering

  • Earthquake research: capturing full 6-DOF motions near seismic sources
  • Structural engineering: studying torsional dynamics in bridges, towers, and dams
  • Seismic arrays: enhancing data from permanent and temporary networks
  • Geotechnical studies: advancing understanding of soil-structure interaction

Conclusion: Expanding the Future of Seismic Monitoring

Rotational seismology is redefining the way earthquakes are studied and structures are safeguarded. With its high precision, wide dynamic range, and field-proven durability, Tellus-R provides the critical measurements needed to push seismic science forward.

Seeing is Believing — explore how Tellus-R can revolutionize your seismic projects. Contact sales@quakelogic.net to learn more.


Last reviewed: 2026-07-04

Executive Summary

Structural health monitoring uses sensors, data acquisition, signal processing, and engineering interpretation to track condition and detect abnormal response. This article has been expanded as an engineering resource for readers evaluating structural health monitoring concepts, instrumentation choices, and monitoring workflows. The discussion is educational and should be paired with project-specific review by qualified engineers, applicable codes, owner requirements, and equipment documentation.

Key Takeaways

  • Define the engineering objective before selecting sensors, test equipment, trigger thresholds, or reporting workflows.
  • Use calibrated instrumentation, documented installation practices, time synchronization, and traceable data handling where measurement quality matters.
  • Interpret measured data in context: site conditions, structure type, noise environment, sampling rate, bandwidth, and boundary conditions all affect conclusions.
  • Use authoritative references and project-specific criteria rather than relying on generic thresholds or unsupported performance claims.

Technical Explanation

In practical structural health monitoring work, the engineering system is more than a sensor or a test platform. A credible workflow includes the measurement objective, instrument selection, mounting or boundary conditions, sampling and timing strategy, data validation, event or response detection, engineering review, and reporting. Weakness in any part of that chain can reduce confidence in the final interpretation.

For monitoring applications, engineers should document sensor orientation, coupling, environmental exposure, dynamic range, frequency bandwidth, data logger configuration, clock synchronization, communications, and maintenance procedures. For testing applications, engineers should document input motion, fixture design, payload properties, control limits, safety interlocks, acceptance criteria, and post-test data review.

Engineering Applications

ApplicationEngineering QuestionTypical Evidence Needed
Research and educationHow does a structure, component, or sensor respond under controlled conditions?Test plan, calibrated data, input motion, boundary conditions, and repeatable observations.
Critical infrastructureIs the asset response normal, changing, or potentially unsafe after an event?Baseline data, event records, thresholds, inspection workflow, and engineering sign-off.
Industrial facilitiesCan monitoring support operational continuity and response decisions?Site-specific criteria, reliable telemetry, alarm logic, maintenance records, and documented procedures.

People Also Ask

What should be specified before buying equipment?

Specify the measurement objective, frequency range, amplitude range, environment, data format, timing needs, installation constraints, reporting requirements, and applicable standards or owner criteria.

Why do references and standards matter?

They provide terminology, acceptance criteria, test methods, and documentation expectations. They do not replace engineering judgment, but they reduce ambiguity and make results easier to review.

How should data quality be checked?

Review calibration status, timing, clipping, sensor orientation, signal-to-noise ratio, environmental artifacts, data completeness, and whether the record supports the engineering decision being made.

Related QuakeLogic Resources

References

Recommended Diagram or Download

Media placeholder: Add an original diagram showing the measurement chain from sensor or test platform to data acquisition, analysis, engineering interpretation, and reporting. Where this article becomes a buyer guide or application note, create a downloadable PDF version after engineering review.

Discuss a Monitoring or Testing Application

QuakeLogic supports seismic monitoring, earthquake early warning, structural health monitoring, infrasound monitoring, vibration monitoring, data acquisition, and shake table testing applications. For project-specific guidance, contact QuakeLogic with the asset type, measurement objective, site constraints, and required deliverables.

ASCE 7-22 VS30 Site Classification Requirements: DoReMi® MASW Turnkey Seismograph + SEISMOWIN Solution

DOREMI 9 Photoroom for "MASW and ReMi: Unlocking Subsurface Insights with DoReMi Seismograph"

Streamline ASCE 7-22 VS30 Site Classification Using DoReMi® MASW Seismographs with SEISMOWIN

The latest ASCE 7-22 standard requires Vs30 shear wave velocity measurements as a key parameter for site classification and seismic design. This shift makes reliable, efficient, and accurate seismic characterization of soils more critical than ever for geotechnical engineers, structural designers, and regulatory compliance.

The DoReMi® Seismograph is the perfect solution. Its digital telemetry system with embedded electronics offers unmatched efficiency, scalability, and modularity. Each channel operates as an independent seismograph, enabling networks from 1 to 255 channels for projects of any scale. Lightweight, durable, and powered by a rechargeable battery with smart standby mode, DoReMi® ensures seamless field deployment and uninterrupted operation. With over 15 years of proven reliability and hundreds of global clients, it is a trusted standard in seismic surveys and geotechnical site investigations.

Paired with SEISMOWIN, a complete seismic data management and analysis suite, the DoReMi® becomes a turnkey solution for Vs30 determination. SEISMOWIN’s MASW (Multichannel Analysis of Surface Waves) and ReMi (Refraction Microtremor) modules provide advanced tools to analyze both active-source surface waves and ambient noise, ensuring flexibility in diverse field conditions. MASW delivers detailed S-wave velocity profiles comparable to borehole logs—without being affected by velocity reversals—while ReMi excels in noisy environments where passive surveys are preferable.

Together, DoReMi® + SEISMOWIN empower engineers to quickly and confidently obtain Vs30 values required under ASCE 7-22, streamlining the entire workflow from data acquisition to final reporting. In-house design, production, and support guarantee fast service, expert training, and customization to meet project-specific needs.

Turnkey Package Includes:

  • DoReMi® Seismograph with 12 or 24+ channels and 4.5 Hz geophones
  • SEISMOWIN software with MASW & ReMi modules
  • Complete field-ready system with battery, cabling, and accessories
  • Training and technical support

With this integrated solution, compliance with ASCE 7-22 site classification requirements is no longer a challenge—it’s an opportunity to deliver faster, more reliable, and cost-effective results.

DoReMi Seismograph: The All-in-One Solution

Key Features of DoReMi Seismograph:

  • Modular Design: Scalable to support 1 to 255 channels, allowing flexible configurations for diverse projects.
  • Embedded Recording Electronics: Electronics are embedded in the cable, reducing electromagnetic interference.
  • Lightweight & Portable: Easily transported with a cable wheeler, ensuring smooth deployment in remote sites.
  • Integrated Battery System: Built-in rechargeable battery ensures continuous and independent operation.
  • Noise Reduction: Digitalization near the geophone minimizes noise and prevents data loss or crosstalk.
  • Flexible Sensor Integration: Supports 4.5 Hz geophones, downhole sensors (SS-BH-5C), and other seismic equipment.
  • Free Analysis Software: Compatible with any processing software, simplifying data management and interpretation.
  • DOREMI 9 Photoroom for "MASW and ReMi: Unlocking Subsurface Insights with DoReMi Seismograph"
  • DOREMI 6 Photoroom for "MASW and ReMi: Unlocking Subsurface Insights with DoReMi Seismograph"
  • DOREMI 7 Photoroom for "MASW and ReMi: Unlocking Subsurface Insights with DoReMi Seismograph"
  • DOREMI 5 Photoroom for "MASW and ReMi: Unlocking Subsurface Insights with DoReMi Seismograph"
  • DOREMI 2 Photoroom for "MASW and ReMi: Unlocking Subsurface Insights with DoReMi Seismograph"
  • DOREMI 8 Photoroom for "MASW and ReMi: Unlocking Subsurface Insights with DoReMi Seismograph"
  • DOREMI 3 Photoroom for "MASW and ReMi: Unlocking Subsurface Insights with DoReMi Seismograph"

Advanced Software for Seamless Operation

The DoReMi Seismograph is complemented by advanced software tools, designed to streamline on-site data quality checks and post-processing workflows.

Key Software Capabilities:

  • Pre-Shot Noise Monitoring: Ensures data integrity before acquisition.
  • Downhole & Surface Data Management: Simplifies different acquisition scenarios.
  • Signal Inversion & Overlapping: For SH shots and advanced processing.
  • Data Filtering & Spectral Analysis: Advanced tools for FK and FV analysis.
  • Roll-Along Acquisition: Simplifies large-area surveys.
  • HVSR Preview: Horizontal-to-Vertical Spectral Ratio preview for subsurface mapping.
  • Multi-Language Support: Available in English, Italian, and Chinese.

Applications of DoReMi Seismograph

  • Seismic Hazard Assessment: Earthquake resilience site characterization.
  • Geophysical Exploration: MASW, ReMi, Refraction, Reflection, and Downhole surveys.
  • Infrastructure Projects: Foundation analysis and underground mapping.
  • Resource Exploration: Aquifer detection, oil and gas reservoir profiling.
  • Urban Development: Roadbed evaluations and soil stiffness assessments.

Data Outputs from DoReMi Seismograph

  1. 1D Shear Wave Velocity Profile:
    • Vertical shear-wave velocity analysis for site characterization.
  2. 2D Shear Wave Velocity Profile:
    • Comprehensive subsurface mapping when multiple acquisitions are performed.

These outputs are essential for geotechnical engineers, seismologists, and urban planners in making informed decisions.

Why Choose DoReMi Seismograph for MASW and ReMi Surveys?

  • Dual Capability: Seamlessly supports both MASW and ReMi techniques.
  • High Precision: Noise-free, reliable data acquisition.
  • Scalable Design: Flexible configurations from 1 to 255 channels.
  • Advanced Software Integration: Simplified analysis and data management.
  • Portability: Lightweight design with modular architecture.
  • Expert Support: Dedicated training, support, and consultation from QuakeLogic.

Conclusion

The DoReMi Seismograph by QuakeLogic represents a state-of-the-art solution for MASW and ReMi seismic surveys, offering unmatched flexibility, precision, and reliability. Whether it’s mapping shallow shear-wave velocity using MASW or profiling deeper subsurface layers with ReMi, DoReMi delivers results you can trust.

Experience precision, reliability, and innovation with the DoReMi Seismograph—your trusted partner in seismic exploration.

📞 For more information or to request a demo, contact us at:
Phone: +1-916-899-0391
Email: sales@quakelogic.net
Website: https://products.quakelogic.net/product/doremi-seismographs/


Last reviewed: 2026-07-04

Executive Summary

Seismic sensors and seismographs convert ground motion into usable engineering data for site characterization, monitoring, event detection, and post-event analysis. This article is maintained as a QuakeLogic engineering resource for readers evaluating terminology, applications, instrumentation, and practical implementation considerations. The content is educational and should be reviewed against project-specific requirements, applicable standards, manufacturer documentation, and qualified engineering judgment.

Key Takeaways

  • Start with the engineering objective, operating environment, required measurements, and decision workflow.
  • Use calibrated instrumentation, documented configuration, appropriate sampling, and traceable data handling where results support engineering decisions.
  • Interpret results in context; boundary conditions, installation quality, noise, bandwidth, and site conditions can materially affect conclusions.
  • Use standards and references as guidance, not as substitutes for project-specific engineering review.

Technical Explanation

A credible engineering workflow links the physical system, the measurement chain, data acquisition, processing, interpretation, and reporting. For testing, that means documenting the input, payload, fixture, limits, safety controls, and acceptance criteria. For monitoring, that means documenting sensor type, placement, orientation, coupling, timing, communications, maintenance, alarm logic, and review procedures.

Engineering Applications

Use CasePrimary QuestionUseful Documentation
Research or educationWhat behavior can be measured, demonstrated, or repeated?Test plan, configuration notes, input data, calibration records, and observations.
Infrastructure or facility monitoringIs response normal, changing, or outside expected limits?Baseline data, event records, thresholds, inspection notes, and engineering review.
Product or system selectionWhich specifications matter for the application?Measurement range, bandwidth, accuracy, environment, integration needs, and deliverables.

People Also Ask

What information should be gathered before selecting equipment?

Define the measurement objective, expected amplitude and frequency range, installation environment, data format, timing requirements, communications, reporting needs, and applicable standards.

How can data quality be protected?

Use appropriate sensor mounting, calibration, channel naming, time synchronization, clipping checks, noise review, and documented maintenance procedures.

When is human engineering review required?

Human review is required when results affect safety, compliance, operations, procurement, structural assessment, or emergency response decisions.

Related Technologies and Resources

References

Recommended Media

Media placeholder: Add an original diagram, workflow graphic, comparison chart, product illustration, lab photograph, or installation schematic after technical review. Do not use stock imagery where readers need to inspect real equipment or engineering details.

Discuss an Application with QuakeLogic

QuakeLogic supports seismic monitoring, earthquake early warning, structural health monitoring, infrasound monitoring, vibration monitoring, data acquisition, robotics education, and shake table testing workflows. For project-specific guidance, contact QuakeLogic with the application, measurement objective, environment, and required deliverables.

TTL vs RS232 vs RS485: Choosing the Right Communication Standard for SHM

Infographic comparing TTL, RS232, RS485, and Modbus communication standards, showing distance limits, topologies, and typical applications in electronics and industrial automation.

In the world of electronics, industrial automation, and instrumentation, reliable communication between devices is essential. Several well-established standards define how devices exchange information. Among the most common are TTL, RS232, RS485, and the Modbus protocol. Let’s explore what they are, their limitations, and where they are typically used.


What is TTL?

Transistor-Transistor Logic (TTL) communication is a simple, low-voltage, point-to-point signaling method.

  • Voltage Levels: Logic “0” is typically 0V, and logic “1” is +5V (sometimes +3.3V in modern systems).
  • Use Case: TTL is often found inside microcontrollers, sensors, and development boards such as Arduino or Raspberry Pi.

Limitations of TTL:

  • Not noise-resistant.
  • Short distance only, typically a few centimeters to 1–2 meters.
  • Direct connection between boards; no error checking or addressing.

TTL is best suited for board-level communication where wires are short and interference is minimal.


What is RS232?

RS232 is one of the oldest and most widely used serial communication standards.

  • Voltage Levels: A logic “1” is represented by –3V to –15V, and logic “0” by +3V to +15V.
  • Topology: Point-to-point (one transmitter, one receiver).
  • Common Use: Serial ports on computers, modems, CNC machines, lab instruments.

Limitations of RS232:

  • Maximum cable length is about 15 meters (50 feet) at standard baud rates (up to ~115 kbps).
  • Only supports one-to-one communication.
  • Susceptible to noise and ground potential differences.

Despite its age, RS232 remains popular in legacy equipment and industrial systems.


What is RS485?

RS485 is a differential signaling standard designed for robust and long-distance communication.

  • Voltage Levels: Uses differential pairs (A and B lines) for noise immunity.
  • Topology: Supports multi-drop networks (up to 32 nodes on a single bus).
  • Common Use: Industrial automation, motor controllers, PLCs, and building management systems.

Limitations of RS485:

  • Maximum distance: up to 1200 meters (4000 feet) at 100 kbps.
  • Higher baud rates reduce allowable cable length.
  • Requires proper termination resistors to avoid signal reflections.

RS485 is well-suited for noisy environments and large facilities where multiple devices need to communicate reliably.


Cable Lengths at a Glance

StandardTypical DistanceBaud Rate RangeTopology
TTL< 2 mUp to MbpsPoint-to-point
RS232~15 m (50 ft)Up to ~115 kbpsPoint-to-point
RS485~1200 m (4000 ft)Up to 10 Mbps (shorter distances)Multi-drop bus

What is Modbus?

Modbus is a communication protocol developed in the late 1970s for industrial automation. Unlike TTL, RS232, and RS485 (which are physical layer standards), Modbus defines how data is structured and exchanged.

  • Modbus RTU: Runs over RS485 (most common) or RS232. Data is exchanged in a compact binary format.
  • Modbus TCP: Uses Ethernet for communication.
  • Applications: SCADA systems, PLCs, power meters, sensors, and industrial controllers.

Key Features:

  • Master-slave (RTU) or client-server (TCP) architecture.
  • Widely adopted and supported by thousands of industrial devices.
  • Simple, lightweight, and open protocol.

Final Thoughts

  • TTL is ideal for short, on-board communication.
  • RS232 works well for point-to-point connections over moderate distances.
  • RS485 excels in industrial environments requiring long cable runs and multiple devices.
  • Modbus provides the language on top of RS485 or TCP/IP for structured, reliable data exchange.

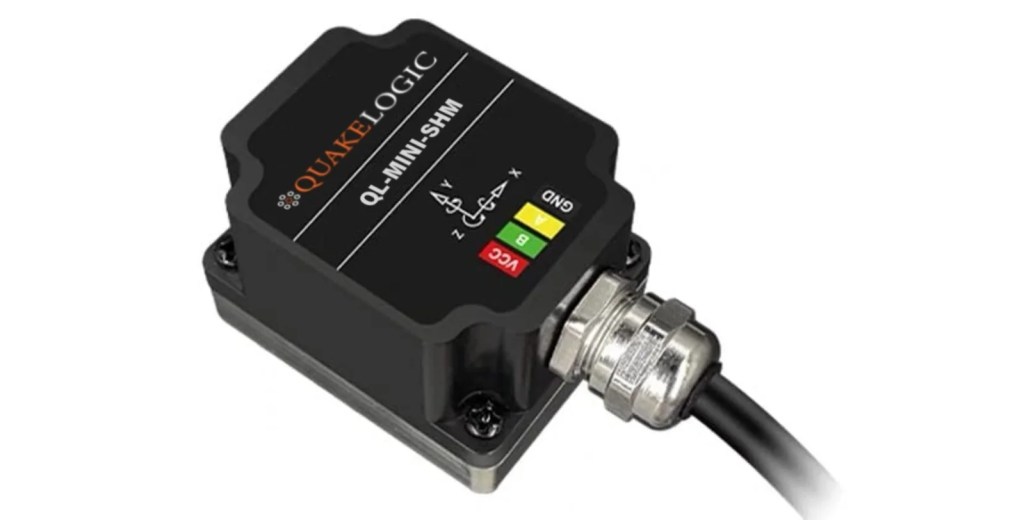
👉 At QuakeLogic, we provide the QL-MINI Series multi-sense sensors, which support TTL, RS232, and RS485 options depending on your intended application. Whether you need short-range board-level integration, reliable point-to-point connectivity, or robust multi-device networking, the QL-MINI line has you covered.

🔗 Explore more here:


Last reviewed: 2026-07-04

Executive Summary

Data acquisition systems synchronize, digitize, store, transmit, and quality-check sensor signals used in seismic, vibration, acoustic, and SHM workflows. This article has been expanded as an engineering resource for readers evaluating data acquisition systems concepts, instrumentation choices, and monitoring workflows. The discussion is educational and should be paired with project-specific review by qualified engineers, applicable codes, owner requirements, and equipment documentation.

Key Takeaways

  • Define the engineering objective before selecting sensors, test equipment, trigger thresholds, or reporting workflows.
  • Use calibrated instrumentation, documented installation practices, time synchronization, and traceable data handling where measurement quality matters.
  • Interpret measured data in context: site conditions, structure type, noise environment, sampling rate, bandwidth, and boundary conditions all affect conclusions.
  • Use authoritative references and project-specific criteria rather than relying on generic thresholds or unsupported performance claims.

Technical Explanation

In practical data acquisition systems work, the engineering system is more than a sensor or a test platform. A credible workflow includes the measurement objective, instrument selection, mounting or boundary conditions, sampling and timing strategy, data validation, event or response detection, engineering review, and reporting. Weakness in any part of that chain can reduce confidence in the final interpretation.

For monitoring applications, engineers should document sensor orientation, coupling, environmental exposure, dynamic range, frequency bandwidth, data logger configuration, clock synchronization, communications, and maintenance procedures. For testing applications, engineers should document input motion, fixture design, payload properties, control limits, safety interlocks, acceptance criteria, and post-test data review.

Engineering Applications

ApplicationEngineering QuestionTypical Evidence Needed
Research and educationHow does a structure, component, or sensor respond under controlled conditions?Test plan, calibrated data, input motion, boundary conditions, and repeatable observations.
Critical infrastructureIs the asset response normal, changing, or potentially unsafe after an event?Baseline data, event records, thresholds, inspection workflow, and engineering sign-off.
Industrial facilitiesCan monitoring support operational continuity and response decisions?Site-specific criteria, reliable telemetry, alarm logic, maintenance records, and documented procedures.

People Also Ask

What should be specified before buying equipment?

Specify the measurement objective, frequency range, amplitude range, environment, data format, timing needs, installation constraints, reporting requirements, and applicable standards or owner criteria.

Why do references and standards matter?

They provide terminology, acceptance criteria, test methods, and documentation expectations. They do not replace engineering judgment, but they reduce ambiguity and make results easier to review.

How should data quality be checked?

Review calibration status, timing, clipping, sensor orientation, signal-to-noise ratio, environmental artifacts, data completeness, and whether the record supports the engineering decision being made.

Related QuakeLogic Resources

References

Recommended Diagram or Download

Media placeholder: Add an original diagram showing the measurement chain from sensor or test platform to data acquisition, analysis, engineering interpretation, and reporting. Where this article becomes a buyer guide or application note, create a downloadable PDF version after engineering review.

Discuss a Monitoring or Testing Application

QuakeLogic supports seismic monitoring, earthquake early warning, structural health monitoring, infrasound monitoring, vibration monitoring, data acquisition, and shake table testing applications. For project-specific guidance, contact QuakeLogic with the asset type, measurement objective, site constraints, and required deliverables.